Work has initiated a Coursera led training program so it is goodbye to Dataquest for now.
The “Applied Data Science Capstone” in the IBM Specialiation has participants using Foursquare business venue data retrieved via an API to solve a business or other problem.
I have decided to investigate the utilisation of loans under the Small Business Administration Paycheck Protection Program in the United States.
What follows is a brief outline of the work and findings.
Data and methodology
The aim is to assess the impact of political persuasion or ideology on the utilisation of government financial assistance.
Determining if political persuasion influences uptake of loans requires us to do three things:
1. Quantify loan uptake
2. Assess political persuasion
3. Identify and hold other characteristics constant
Loan uptake data is published by the US treasury. Political persuasion was inferred from electoral data, and the other characteristics to control for come from census data (demographic information) and Foursquare business venue data.
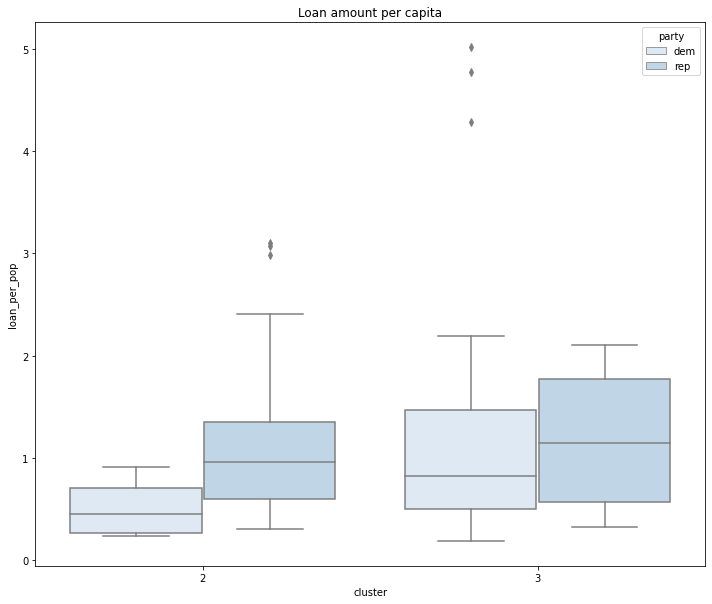
A clustering algorithm was been used to group geographical areas into similar groups using the demographic and business venue data. These clusters are the control groups - similar geograpic areas with respect to demographics.
The box plots below show the difference in distribution of loan amount over the clusters.

Conclusion
I ultimately concluded that the results of the analysis themselves were inconclusive. Basically I realised I could not retrieve enough Foursquare data to create a sample size large enough.
It’s interesting the I probably bit off more than I could chew on this project. A lot of time was spent data munging the various source, playing with json (painfull), and generally getting the workflow to work. The result was that the time availabe for analysis and reporting suffered. Lesson learnt. Keep it simple next time.
This is going to be only a very short post, all of the analysis and the report are here and here.